Hypertension, a primary component of cardiovascular diseases, has been a major cause of morbidity and mortality worldwide because individuals are not able to prevent risk factors to its development. Rising cases of hypertension in Sub Saharan Africa have been attributed to undiagnosed, untreated and inadequately treated hypertension. The prevalence however varies based on rural and urban population residences and risk factors. The risk of developing hypertension is associated with diet composed of high content of saturated fats, salt and trans-fats, low fruit and vegetable intake. Limited studies have been done to compare diet uptake and development of hypertension in rural and urban areas in order to have specific, targeted prevention measures. This study therefore called for the need to determine dietary consumption patterns and development of hypertension among urban and rural populations of Kisii County. The methodology entailed residents aged 30-69 years, from urban and rural population of Nyaribari Chache Sub County, Kisii County who were sampled resulting in 490 respondents. Random sampling technique was used and all who met the inclusion criteria were interviewed. Statistical Package for Social Scientists (SPSS) Version 21 was used to analyze data. Results from the study indicated that te prevalence of hypertension for the sampled population was 44.668%; for urban 43.598% and 44.134% for rural. Frequency of fruit consumption (p=0.002) and fruit servings (p=0.018) in a typical week, amount of salt intake (p=0.006) and significance of salt levels (p=0.032) were statistically significant. The population also depicted a poor diet uptake of only one fruit in a typical week (25.7% urban, 30.5% rural), a prior indicator of the existence of a relationship between the predictor and the predicted variables. The study therefore concludes and recommends that residents residing in rural populations should be empowered with knowledge on prevention, early detection and management practices of hypertension which will result in a healthy lifestyle.
| Published in | American Journal of Nursing Science (Volume 14, Issue 4) |
| DOI | 10.11648/j.ajns.20251404.11 |
| Page(s) | 57-67 |
| Creative Commons |
This is an Open Access article, distributed under the terms of the Creative Commons Attribution 4.0 International License (http://creativecommons.org/licenses/by/4.0/), which permits unrestricted use, distribution and reproduction in any medium or format, provided the original work is properly cited. |
| Copyright |
Copyright © The Author(s), 2025. Published by Science Publishing Group |
Hypertension, Diet, Rural, Urban, Kisii, Kenya
Urban | Rural | ||||
|---|---|---|---|---|---|
Frequency (N) | (%) | Frequency | (%) | ||
Residence | 328 | 65.8 | 169 | 34.2 | |
Age | 30-34 | 63 | 19.3 | 28 | 16.5 |
35-39 | 64 | 19.3 | 25 | 15.3 | |
40-44 | 38 | 11.6 | 15 | 8.8 | |
45-49 | 36 | 11 | 26 | 15.3 | |
50-54 | 39 | 11.9 | 15 | 8.8 | |
55-59 | 27 | 8.3 | 26 | 15.3 | |
60-64 | 33 | 10.1 | 12 | 7.1 | |
65-69 | 28 | 8.6 | 22 | 12.9 | |
Village | Nyaura | 162 | 49.4 | 50 | 29.6 |
Kiamabundu | 37 | 11.3 | 16 | 9.5 | |
Nyanchwa | 58 | 17.7 | 12 | 7.1 | |
Nyamware | 42 | 12.8 | 58 | 34.3 | |
Boronyi | 29 | 8.8 | 33 | 19.5 | |
Sex | Male | 137 | 41.8 | 64 | 37.9 |
Female | 191 | 58.2 | 105 | 62.1 | |
Marital Status | Never Married | 35 | 10.7 | 20 | 11.8 |
Currently Married | 261 | 79.6 | 131 | 77.5 | |
Separated | 10 | 3 | 5 | 3.0 | |
Divorced | 10 | 3 | 0 | 0 | |
Widowed | 12 | 3.7 | 13 | 7.7 | |
Highest Education Level | Informal schooling | 26 | 7.9 | 13 | 7.7 |
< Primary School | 74 | 22.6 | 40 | 23.7 | |
Finalized Primary School | 123 | 37.5 | 62 | 36.7 | |
Finalized SecondarySchool | 76 | 23.2 | 40 | 23.7 | |
Finalized Tertiary level | 29 | 8.8 | 14 | 8.3 | |
Main working status over last 12 months | Government Employee | 16 | 4.9 | 8 | 4.7 |
Self Employed | 253 | 77.1 | 111 | 65.7 | |
Unemployed (Able to work) | 59 | 18.0 | 50 | 29.6 | |
Estimated Range of monthly income | 0-7,000 | 113 | 34.5 | 82 | 48.5 |
7,000-20,000 | 81 | 24.7 | 43 | 25.4 | |
20,000-100,000 | 14 | 4.3 | 11 | 6.5 | |
Refused to respond | 120 | 36.6 | 33 | 19.5 | |
Urban | Rural | ||||
|---|---|---|---|---|---|
Frequency (N) | % | Frequency (N) | % | ||
Fruit consumption in a typical week | 0 | 43 | 13.1 | 28 | 16.6 |
1 | 94 | 28.7 | 47 | 27.8 | |
2 | 78 | 23.8 | 22 | 13.0 | |
3 | 32 | 9.8 | 19 | 11.2 | |
4 | 6 | 1.8 | 5 | 3.0 | |
5 | 9 | 2.7 | 2 | 1.2 | |
6 | 11 | 3.4 | 1 | 0.6 | |
7 | 55 | 16.8 | 45 | 26.6 | |
Fruit servings per week | 0 | 33 | 10.1 | 23 | 13.6 |
1 | 183 | 55.8 | 84 | 49.7 | |
2 | 72 | 22 | 27 | 16.0 | |
3 | 16 | 4.9 | 17 | 10.1 | |
4 | 24 | 7.3 | 18 | 10.7 | |
0 | 19 | 5.8 | 12 | 7.1 | |
Days eaten vegetables per week | 1 | 8 | 2.4 | 2 | 1.2 |
2 | 3 | 0.9 | 11 | 6.5 | |
3 | 12 | 3.7 | 5 | 3.0 | |
4 | 11 | 3.4 | 3 | 1.8 | |
5 | 9 | 2.7 | 4 | 2.4 | |
6 | 57 | 17.4 | 52 | 30.8 | |
7 | 209 | 63.7 | 80 | 47.3 | |
0 | 19 | 5.8 | 12 | 7.1 | |
Vegetable servings per week | 1 | 77 | 23.5 | 32 | 18.9 |
2 | 215 | 65.5 | 99 | 58.6 | |
3 | 12 | 3.7 | 17 | 10.1 | |
4 | 5 | 1.5 | 9 | 5.3 | |
Frequency of adding salt to food before or during consumption | Always | 22 | 6.7 | 21 | 12.4 |
Often | 13 | 4.0 | 7 | 4.1 | |
Sometimes | 79 | 24.1 | 33 | 19.5 | |
Rarely | 77 | 23.5 | 31 | 18.3 | |
Never | 137 | 41.8 | 77 | 45.6 | |
Consume processed food with high salt intake | Always | 11 | 3.4 | 11 | 6.5 |
Often | 9 | 2.7 | 5 | 3 | |
Sometimes | 66 | 20.1 | 32 | 18.9 | |
Rarely | 44 | 13.4 | 33 | 19.5 | |
Never | 198 | 60.4 | 88 | 52.1 | |
Amount of salt intake | Far too much | 10 | 3 | 4 | 2.4 |
Too much | 32 | 9.8 | 14 | 8.3 | |
Just the right amount | 129 | 39.3 | 74 | 43.8 | |
Too little | 129 | 39.3 | 61 | 36.1 | |
Far too little | 28 | 8.5 | 16 | 9.5 | |
Significance of salt levels | Very important | 199 | 60.7 | 126 | 74.6 |
Somewhat important | 82 | 25 | 17 | 10.1 | |
Not at all important | 8 | 2.4 | 2 | 1.2 | |
Don't know | 39 | 11.9 | 24 | 14.2 | |
Excess salt affects health | Yes | 257 | 78.4 | 136 | 80.5 |
No | 40 | 12.2 | 13 | 7.7 | |
Don't know | 31 | 9.5 | 20 | 11.8 | |
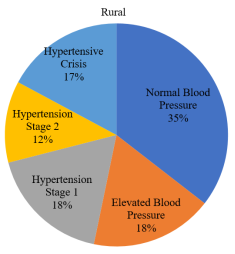
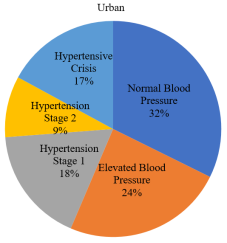
Blood Pressure Category (Systolic/Diastolic count in mmHg) | Urban | Urban% | Rural | Rural% | Total |
|---|---|---|---|---|---|
Normal Blood Pressure (<120/<80) | 106 | 32.3 | 60 | 35.5 | 166 |
Elevated Blood Pressure (120-129/<80) | 79 | 24.1 | 30 | 17.8 | 109 |
Hypertension Stage 1 (130-139/80-89) | 57 | 17.4 | 30 | 17.8 | 87 |
Hypertension Stage 2 (>140/>90) | 30 | 9.1 | 20 | 11.8 | 50 |
Hypertensive Crisis (>180/>120) | 56 | 17.1 | 29 | 17.2 | 85 |
| Hypertension Prevalence | |||
|---|---|---|---|---|
Variables | Category | Yes | No | Chi square test, df |
Frequency of fruit consumption in a typical week | 0 | 43 (19.4%) | 28 (10.2%) | χ2=22.988 df=7 P=0.002* |
1 | 57 (25.7%) | 84 (30.5%) | ||
2 | 55 (24.8%) | 28 (10.2%) | ||
3 | 23 (2.3%) | 6 (2.2%) | ||
4 | 9 (4.1%) | 12 (4.4%) | ||
6 | 6 (2.7%) | 6 (2.2%) | ||
7 | 29 (13.1) | 71 (25.8%) | ||
Fruit servings per week | 0 | 36 (16.2%) | 20 (7.3%) | χ2=11.865 df=4 P=0.018* |
1 | 111 (50.0%) | 156 (56.7%) | ||
2 | 40 (18.0%) | 59 (21.5%) | ||
3 | 13 (5.9%) | 20 (7.3%) | ||
4 | 22 (9.9%) | 20 (7.3%) | ||
0 | 17 (7.7%) | 14 (5.1%) | ||
Vegetables servings per week | 1. | 44 (19.8%) | 65 (23.6%) | χ2=4.314 df=4 p=0.365 |
2. | 139 (62.6%) | 175 (63.6%) | ||
3. | 13 (5.9%) | 16 (5.8%) | ||
4. | 9 (4.1%) | 5 (1.8%) | ||
Adding salt to meals | Always | 57 (25.7%) | 98 (35.6%) | χ2=6.267 df=5 p=0.281 |
Often | 5 (2.3%) | 7 (2.5%) | ||
Sometimes | 43 (19.4%) | 43 (15.6%) | ||
Rarely | 26 (11.7%) | 28 (10.2%) | ||
Never | 90 (40.5%) | 97 (35.3%) | ||
Frequency of salt seasoning in cooking food | Always | 17 (7.7%) | 26 (9.5%) | χ2=5.987 df=4 p=0.200 |
Often | 6 (2.7%) | 14 (5.1%) | ||
Sometimes | 44 (19.8%) | 68 (24.7%) | ||
Rarely | 56 (25.2%) | 52 (18.9%) | ||
Never | 99 (44.6%) | 115 (41.9%) | ||
Consume processed food with high salt intake | Always | 10 (4.5%) | 12 (4.4%) | χ2=9.029 df=4 p=0.060 |
Often | 5 (2.3%) | 9 (3.3%) | ||
Sometimes | 32 (14.4%) | 66 (24.0%) | ||
Rarely | 41 (18.5%) | 36 (13.1%) | ||
Never | 134 (60.4%) | 152 (55.3%) | ||
Amount of salt intake | Far too much | 12 (5.4%) | 2 (0.7%) | χ2=14.469 df=4 p=0.006* |
Too much | 20 (9.0%) | 26 (9.5%) | ||
Just the right amount | 82 (36.9%) | 121 (44.0%) | ||
Too little | 93 (41.9%) | 97 (35.3%) | ||
Far too little | 15 (6.8%) | 29 (10.5%) | ||
Significance of salt levels | Very important | 146 (65.8%) | 169 (65.1%) | χ2=8.778 df=3 p=0.032* |
Somewhat important | 36 (16.2%) | 63 (22.9%) | ||
Not at all important | 8 (3.6%) | 10 (3.7%) | ||
Don't know | 32 (14.4%) | 31 (11.3%) | ||
Presence of high blood pressure | ||||
|---|---|---|---|---|
Residence | Yes | No | Totals (Residence) | Chi square, Odds Ratio and Relative Risk |
Urban | 143 (64.4%) | 185 (67.3%) | 328 | p=0.504, χ2=0.447, df=1, OR=1.135 Rural, 0.881 Urban RR=1.072 Rural, 0.933 Urban |
Rural | 79 (35.6%) | 90 (32.7%) | 169 | |
Total (Hypertensive) | 222 (100%) | 275 (100%) | 497 | |
DALYs | Disability Adjusted Life Years |
MmHg | Millimeters of Mercury |
SPSS | Statistical Package for Social Scientists |
STEPs | WHO Approach to NCD Risk Factor Surveillance |
WHO | World Health Organization |
| [1] | Whelton, P. K., Carey, R. M., Aronow, W. S., Casey, D. E., Collins, K. J., Himmelfarb, C. D. (2018). 2017 ACC/AHA/AAPA/ABC/ACPM/AGS/APhA/ASH/ASPC/NMA/PCNA guideline for the prevention, detection, evaluation, and management of high blood pressure in adults: a report of the American College of Cardiology/American Heart Association Taskforce on Clinical Pra. Journal of the American College of Cardiology, 71(19), e 127-e 248. |
| [2] | Cappuccio, F. P., & Miller, M. A. (2016). Cardiovascular disease and hypertension in sub-Saharan Africa: burden, risk and interventions. Internal and emergency medicine, 11(3), 299-305. |
| [3] | World Health Organization (2018). WHO plan to eliminate industrially-produced trans-fatty acids from global food supply. |
| [4] | Zhou, B., Bentham, J., Di Cesare, M., Bixby, H., Danaei, G., Cowan, M. J., et al. (2017). Worldwide trends in blood pressure from 1975 to 2015: a pooled analysis of 1479 population-based measurement studies with 19.1 million participants. The Lancet, 389(10064), 37-55. |
| [5] | World Health Organization (2019). Hypertenson Fact Sheet Web Site. |
| [6] | Mensah, G. A. (2016). Tackling noncommunicable diseases in Africa. Caveat Lector. Health Education & Behavior, 43(1), |
| [7] | Rush, K. L., Goma, F. M., Barker, J. A., Ollivier, R. A., Ferrier, M. S., & Sangini, D. (2018). Hypertension prevalence and risk factors in rural and urban Zambian adults in western province: a cross-sectional study. Pan African Medical Journal, 30(97). |
| [8] | Weber, M. A., Schiffrin, E. L., White, W. B., Mann, S., Lindholm, L. H., Cohen, D. L. (2014). Clinical practice guidelines for the management of hypertension in the community: a statement by the American Society of Hypertension and the International Society of Hypertension. The journal of clinical hypertension, 16(1), 14-26. |
| [9] | Lan, N. S., Massam, B. D., Kulkarni, S. S., & Lang, C. C. (2018). Pulmonary arterial hypertension: pathophysiology and treatment. Diseases, 6(2), 38. |
| [10] | Mendis, S., Davis, S., & Norrving, B. (2015). Organizational update: the world health organization global status report on noncommunicable diseases 2014; one more landmark step in the combat against stroke and vascular disease. Stroke, 46(5), e 121-e 122. |
| [11] | Pallazola, V. A., Davis, D. M., Whelton, S. P., Cardoso, R., Latina, J. M., Michos, E. D., et al. (2019). A Clinician's Guide to Healthy Eating for Cardiovascular Disease Prevention. Mayo Clinic Proceedings: Innovations, Quality & Outcomes. |
| [12] | Batchu, S., Hughson, A., Wadosky, K. M., Morrel, C. N., Fowell, D. J., & Kurshunov, V. A. (2016). Role of Axl in T-lymphocyte survival in salt-dependent hypertension. Arteriosclerosis, thrombosis, and vascular biology, 36(8), 1638-1646. |
| [13] | Bosu, W. K., & Bosu, D. K. (2021). Prevalence, awareness and control of hypertension in Ghana: A systematic review and meta-analysis. PloS one, 16(3), e0248137 |
| [14] | Abebe, S. M., Berhane, Y., Worku, A., & Getachew, A. (2015). Prevalence and associated factors of hypertension: a crossectional community based study in Northwest Ethiopia. PloS one, 10(4). |
| [15] | Tabrizi, J. S., Sadeghi-Bazargani, H., Farahbakhsh, M., Nikniaz, L., & Nikniaz, Z. (2016). Prevalence and associated factors of prehypertension and hypertension in Iranian population: The Lifestyle Promotion Project (LPP). PloS one, 11(10). |
| [16] | Prabakaran, J., Vijayalakshmi, N., & VenkataRao, E. (2013). Prevalence of hypertension among urban adult population (25-64 years) of Nellore, India. Int J Res Dev Health, 1(2), 42-49. |
| [17] | Solomon, I., Adjuik, M., Takramah, W., Axame, W. K., Owusu, R., AttaParbey, P., et al. (2017). Prevalence and awareness of hypertension among urban and rural adults in Hohoe Municipality, Ghana. Journal of Marketing Research, 3(3), 136-145. |
| [18] | Boateng, D., Wekesah, F., Browne, J. L., Agyemang, C., Agyei-Baffour, P., Aikins, A. D., et al. (2017). Boateng, D., Wekesah, F., Browne, J. L., AKnowledge and awareness of and perception towards cardiovascular disease risk in sub-Saharan Africa: A systematic review. PloS one, 12(12), e0189264. |
| [19] | Dhungana, R. R., Pandey, A. R., Bista, B, B., Joshi, S., & Devkota, S. (2016). Prevalence and associated factors of hypertension: a community-based cross-sectional study in municipalities of Kathmandu, Nepal. International journal of hypertension. |
| [20] | Singh, S., Shankar, R., & Singh, G. P. (2017). Prevalence and associated risk factors of hypertension: a cross-sectional study in urban Varanasi. International journal of hypertension. |
| [21] | Hendriks, M. E., Wit, F. W., Roos, M. T., Brewster, L. M., Akande, T. M., De Beer, I. H., et al. (2012). Hypertension in sub-Saharan Africa: cross-sectional surveys in four rural and urban communities. PloS one, 7(3). |
| [22] | Kushitor, M. K., & Boatemaa, S. (2018). The double burden of disease and the challenge of health access: Evidence from Access, Bottlenecks, Cost and Equity facility survey in Ghana. PLoS One, 13(3). |
| [23] | Sanuade, O. A., Boatemaa, S., & Kushitor, M. K. (2018). Hypertension prevalence, awareness, treatment and control in Ghanaian population: Evidence from the Ghana demographic and health survey. PloS one, 13(11). |
| [24] | Gupta, R., Gaur, K., & Ram, C. S. (2018). Emerging trends in hypertension epidemiology in India. Journal of human hypertension, 1. |
| [25] | Bâ, H. O., Menta, I., Camara, Y., Sangaré, I., Landoure, G., Millogo, G. R., et al. (2018). Cardiovascular Risk Factors (CVrf) in Rural and Urban Areas Mali: Data from the Step 2013 Survey. World Journal of Cardiovascular Diseases, 8(01), 3. |
| [26] | Mishra, C. P., & Kumar, S. (2017). Risk factors of hypertension in a rural area of Varanasi. Indian Journal of Preventive and Social Medicine, 42(1), 101-111. |
| [27] | Reddy, S. S., & Prabhu, G. R. (2015). Prevalence and risk factors of hypertension in adults in an Urban Slum, Tirupati, AP. Indian Journal of community medicine, 30(3), 84. |
| [28] | Vimala, A., Ranji, S. A., Jyosna, M. T., Chandran, V., Matthews, S. R., & Pappachan, J. M. (2019). The prevalence, risk factors and awareness of hypertension in an urban population of Kerala (South India). Saudi Journal of Kidney Diseases and Transplantation, 20(4), 685. |
| [29] | Ingale, A. S., & Dixit, J. V. (2017). Prevalence of hypertension, awareness & health seeking behaviour among adults residing in field practice area of urban health training centre, government medical college Aurangabad. National Journal of Community Medicine, 8(1), 31-36. |
| [30] | Thankappan, K. R., Mini, G. K., Daivadanam, M., Vijayakumar, G., Sarma, P. S., & Nichter, M. (2013). Smoking cessation among diabetes patients: results of a pilot randomized controlled trial in Kerala, India. BMC Public Health, 13(1), 47. |
| [31] | Ezzati, M., & Riboli, E. (2013). Behavioral and dietary risk factors for noncommunicable diseases. New England Journal of Medicin, 369(10), 954-964. |
APA Style
Ondieki, A. O., Ogugu, N. O., Yator, M. J. (2025). Dietary Consumption Patterns and Development of Hypertension Among Rural and Urban Population of Kisii County, Kenya. American Journal of Nursing Science, 14(4), 57-67. https://doi.org/10.11648/j.ajns.20251404.11
ACS Style
Ondieki, A. O.; Ogugu, N. O.; Yator, M. J. Dietary Consumption Patterns and Development of Hypertension Among Rural and Urban Population of Kisii County, Kenya. Am. J. Nurs. Sci. 2025, 14(4), 57-67. doi: 10.11648/j.ajns.20251404.11
AMA Style
Ondieki AO, Ogugu NO, Yator MJ. Dietary Consumption Patterns and Development of Hypertension Among Rural and Urban Population of Kisii County, Kenya. Am J Nurs Sci. 2025;14(4):57-67. doi: 10.11648/j.ajns.20251404.11
@article{10.11648/j.ajns.20251404.11,
  author = {Alex Ontiri Ondieki and Nickson Okiomeri Ogugu and Medrine Jelimo Yator},
  title = {Dietary Consumption Patterns and Development of Hypertension Among Rural and Urban Population of Kisii County, Kenya
},
  journal = {American Journal of Nursing Science},
  volume = {14},
  number = {4},
  pages = {57-67},
  doi = {10.11648/j.ajns.20251404.11},
  url = {https://doi.org/10.11648/j.ajns.20251404.11},
  eprint = {https://article.sciencepublishinggroup.com/pdf/10.11648.j.ajns.20251404.11},
  abstract = {Hypertension, a primary component of cardiovascular diseases, has been a major cause of morbidity and mortality worldwide because individuals are not able to prevent risk factors to its development. Rising cases of hypertension in Sub Saharan Africa have been attributed to undiagnosed, untreated and inadequately treated hypertension. The prevalence however varies based on rural and urban population residences and risk factors. The risk of developing hypertension is associated with diet composed of high content of saturated fats, salt and trans-fats, low fruit and vegetable intake. Limited studies have been done to compare diet uptake and development of hypertension in rural and urban areas in order to have specific, targeted prevention measures. This study therefore called for the need to determine dietary consumption patterns and development of hypertension among urban and rural populations of Kisii County. The methodology entailed residents aged 30-69 years, from urban and rural population of Nyaribari Chache Sub County, Kisii County who were sampled resulting in 490 respondents. Random sampling technique was used and all who met the inclusion criteria were interviewed. Statistical Package for Social Scientists (SPSS) Version 21 was used to analyze data. Results from the study indicated that te prevalence of hypertension for the sampled population was 44.668%; for urban 43.598% and 44.134% for rural. Frequency of fruit consumption (p=0.002) and fruit servings (p=0.018) in a typical week, amount of salt intake (p=0.006) and significance of salt levels (p=0.032) were statistically significant. The population also depicted a poor diet uptake of only one fruit in a typical week (25.7% urban, 30.5% rural), a prior indicator of the existence of a relationship between the predictor and the predicted variables. The study therefore concludes and recommends that residents residing in rural populations should be empowered with knowledge on prevention, early detection and management practices of hypertension which will result in a healthy lifestyle.},
 year = {2025}
}
TY  - JOUR
T1  - Dietary Consumption Patterns and Development of Hypertension Among Rural and Urban Population of Kisii County, Kenya

AU  - Alex Ontiri Ondieki
AU  - Nickson Okiomeri Ogugu
AU  - Medrine Jelimo Yator
Y1  - 2025/08/19
PY  - 2025
N1  - https://doi.org/10.11648/j.ajns.20251404.11
DO  - 10.11648/j.ajns.20251404.11
T2  - American Journal of Nursing Science
JF  - American Journal of Nursing Science
JO  - American Journal of Nursing Science
SP  - 57
EP  - 67
PB  - Science Publishing Group
SN  - 2328-5753
UR  - https://doi.org/10.11648/j.ajns.20251404.11
AB  - Hypertension, a primary component of cardiovascular diseases, has been a major cause of morbidity and mortality worldwide because individuals are not able to prevent risk factors to its development. Rising cases of hypertension in Sub Saharan Africa have been attributed to undiagnosed, untreated and inadequately treated hypertension. The prevalence however varies based on rural and urban population residences and risk factors. The risk of developing hypertension is associated with diet composed of high content of saturated fats, salt and trans-fats, low fruit and vegetable intake. Limited studies have been done to compare diet uptake and development of hypertension in rural and urban areas in order to have specific, targeted prevention measures. This study therefore called for the need to determine dietary consumption patterns and development of hypertension among urban and rural populations of Kisii County. The methodology entailed residents aged 30-69 years, from urban and rural population of Nyaribari Chache Sub County, Kisii County who were sampled resulting in 490 respondents. Random sampling technique was used and all who met the inclusion criteria were interviewed. Statistical Package for Social Scientists (SPSS) Version 21 was used to analyze data. Results from the study indicated that te prevalence of hypertension for the sampled population was 44.668%; for urban 43.598% and 44.134% for rural. Frequency of fruit consumption (p=0.002) and fruit servings (p=0.018) in a typical week, amount of salt intake (p=0.006) and significance of salt levels (p=0.032) were statistically significant. The population also depicted a poor diet uptake of only one fruit in a typical week (25.7% urban, 30.5% rural), a prior indicator of the existence of a relationship between the predictor and the predicted variables. The study therefore concludes and recommends that residents residing in rural populations should be empowered with knowledge on prevention, early detection and management practices of hypertension which will result in a healthy lifestyle.
VL  - 14
IS  - 4
ER  -
Department of Medical Services (Division of Public Health), Kisii University, Kisii, Kenya
Biography: Alex Ontiri Ondieki is a Public Health professional with over a decade of experience in health care. He has worked with Kisii University, Kisii County Government (Ministry of Health), Planned Parenthood Global among other oldest & largest health and medical giant organizations. He is also the founder and Executive Director for HECOWENA, a health organization in Kenya that deals with Training and Research in the health sector. He has an MPH in Epidemiology and Disease Control from Kenyatta University and currently completing his PhD in Public Health. He has conceptualized, co-designed, led and implemented various high impact health initiatives and programs on infectious and non-infectious diseases, tribal health in remote geographies, reproductive and sexual health, palliative care, women’s health and technology-based innovations, with a focus on primary health care and health system strengthening.
Research Fields: Epidemiology, Public Health, Community Health, Occupational Health and Safety

Ministry of Health, Department of Medical Services and Public Health, Kisii County Government Kisii, Kenya
Research Fields: Epidemiology, Public Health, Community Health, Occupational Health and Safety
Ministry of Health, Department of Medical Services and Public Health, Kisii County Government Kisii, Kenya
Research Fields: Epidemiology, Public Health, Community Health, Occupational Health and Safety